
How the Fiber-Optic Link Budget Calculator Works
A fiber-optic link budget checks whether enough optical power reaches the receiver after the signal passes through the fiber, connectors, splices, splitters, and other passive components. It also checks the opposite failure mode: whether a short, low-loss link can deliver more power than the receiver is designed to accept.
The calculator evaluates the link at two operating limits. Minimum transmitter power is used to test receiver sensitivity and reach. Maximum transmitter power is used to test receiver overload. This creates a usable optical-power window instead of checking only one nominal condition.
The available power budget is the maximum total loss that the link can tolerate before the minimum received power falls below receiver sensitivity.
Total channel loss is the sum of fiber attenuation, mated-connection loss, splice loss, and other passive losses such as splitters, WDM components, filters, and attenuators.
A non-negative result means the modeled link still reaches receiver sensitivity after the selected engineering reserve has been included.
How to Calculate a Fiber Link Budget
1. Start with worst-case transceiver specifications
Read the minimum transmit power, maximum transmit power, receiver sensitivity, and receiver overload level from the transceiver data sheet. Avoid using a typical transmit value for a worst-case reach calculation because it can make the link appear stronger than its guaranteed specification.
2. Calculate fiber attenuation
Multiply the installed fiber length by the specified attenuation at the operating wavelength:
Use the selected cable's maximum specified attenuation when performing a design verification. The calculator's wavelength presets are starting values, not replacements for manufacturer data.
3. Add connectors, splices, and passive devices
Count every mated connection in the optical path, including patch panels and equipment interfaces where applicable. Then add all fusion or mechanical splices and the published insertion loss of splitters, couplers, WDM filters, circulators, attenuators, or other passive components.
4. Reserve margin for real installations
An engineering reserve allows for conditions that are difficult to predict exactly at the design stage. These can include component aging, temperature variation, contamination, additional repair splices, future patching, and measurement uncertainty. The appropriate value depends on the application, specifications, and maintenance strategy.
5. Check both sensitivity and overload
The minimum received power must remain above receiver sensitivity after the reserve is included. At the same time, the maximum received power must remain below the receiver overload level. A link can have abundant reach and still fail because the receiver receives too much optical power.
Important: Positive remaining margin is a planning result, not an installation certificate. Confirm the completed link using calibrated optical-power and loss-test equipment, and follow the applicable project or network standard.
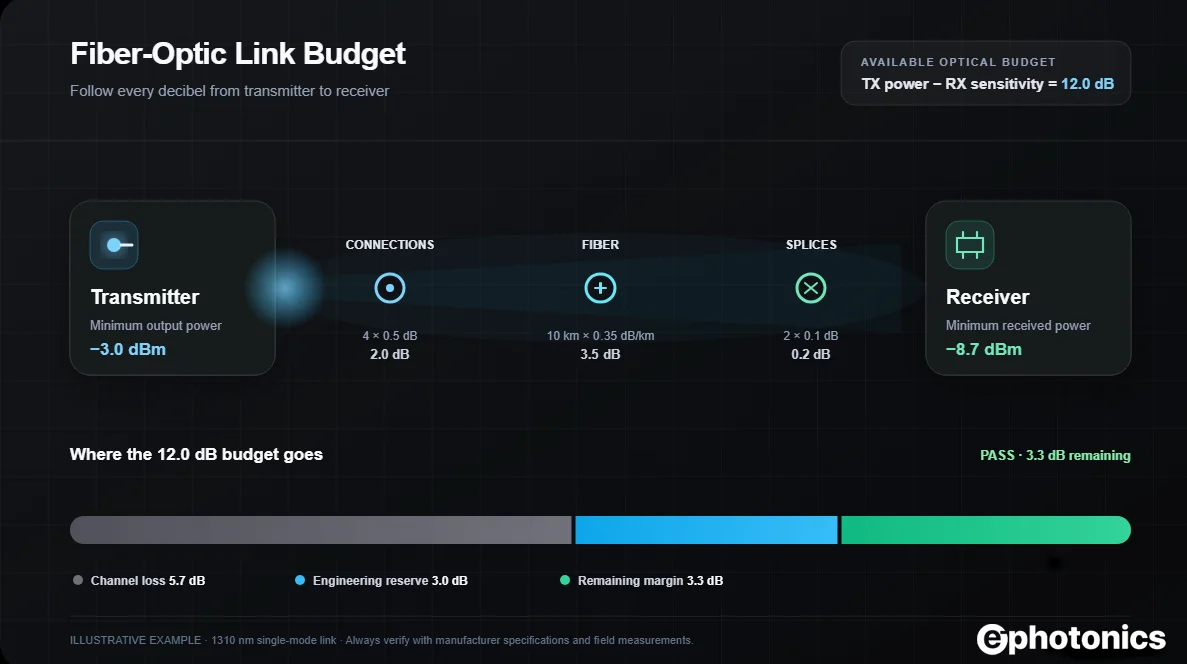
Worked Link-Budget Example
10 km single-mode campus link at 1310 nm
This is the default example provided in the calculator. All values remain editable.
- Available budget:
−3 dBm − (−15 dBm) = 12.0 dB - Fiber loss:
10 km × 0.35 dB/km = 3.5 dB - Connection loss:
4 × 0.50 dB = 2.0 dB - Splice loss:
2 × 0.10 dB = 0.2 dB - Total channel loss:
3.5 + 2.0 + 0.2 = 5.7 dB - Remaining margin after a 3 dB reserve:
12.0 − 5.7 − 3.0 = 3.3 dB - Minimum received power:
−3.0 − 5.7 = −8.7 dBm - Maximum received power:
0.0 − 5.7 = −5.7 dBm, which remains 4.7 dB below a −1 dBm overload limit.
Typical Fiber-Loss Inputs
The following values are broad planning examples. The correct design input is the loss specified for the actual fiber, connectors, splices, passive devices, wavelength, and environmental conditions.
| Loss element | Planning range | How to use it |
|---|---|---|
| Multimode fiber at 850 nm | about 2.5–3.5 dB/km | Use the cable's rated maximum attenuation. |
| Single-mode fiber at 1310 nm | about 0.32–0.40 dB/km | Check cable construction and temperature range. |
| Single-mode fiber at 1550 nm | about 0.18–0.30 dB/km | Include bend and component losses separately. |
| Mated connection | about 0.2–0.75 dB | Count each mated pair and use the project allowance. |
| Fusion splice | about 0.05–0.30 dB | Use the specified or measured splice allowance. |
| Splitter, WDM, or filter | device-specific | Enter the maximum insertion loss from its data sheet. |
Common Link-Budget Mistakes
- Using typical transmitter power: minimum guaranteed TX power should determine the weak-signal case.
- Ignoring receiver overload: maximum TX power and minimum path loss determine the strongest received signal.
- Counting connector hardware incorrectly: define whether the project allowance applies per connector, adapter, or mated pair and remain consistent.
- Forgetting splitters and filters: passive-device insertion loss can dominate PON and wavelength-division links.
- Using map distance: calculate with the installed route length, including vertical runs and service loops.
- Treating a calculated pass as a measurement: real links must still be inspected, cleaned, tested, and documented.
- Ignoring dispersion: adequate optical power does not guarantee the required data performance when modal or chromatic dispersion becomes limiting.
Frequently Asked Questions
What is a fiber-optic link budget?
A fiber-optic link budget is an accounting of optical power from transmitter to receiver. It compares the power available from the transceiver with losses caused by fiber, connections, splices, passive devices, and the chosen engineering reserve.
What does positive link margin mean?
Positive remaining margin means the modeled minimum received power stays above receiver sensitivity after all entered losses and the selected reserve are subtracted. It does not replace verification with the actual equipment and installed fiber.
What is the difference between power budget and loss budget?
The available power budget comes from the transmitter and receiver specifications. The loss budget describes how that available amount is consumed by the optical path and engineering allowances.
Why does the calculator require minimum and maximum TX power?
Minimum TX power is needed for the receiver-sensitivity and maximum-distance calculation. Maximum TX power is needed to determine whether a low-loss link could overload the receiver.
How much engineering margin should I use?
There is no universal value for every network. The required reserve depends on the governing standard, equipment specifications, installation quality, environment, expected repairs, aging, and operational risk. Use the value required by your design authority or project specification.
Can a fiber link fail even when the optical margin is positive?
Yes. Incorrect wavelength or fiber type, excessive dispersion, reflectance, dirty connectors, receiver overload, incompatible encoding, or equipment faults can prevent operation even when an optical-power calculation appears acceptable.
When is an optical attenuator required?
An attenuator may be required when the calculated maximum received power is higher than the receiver overload limit. Select its value using the worst-case TX maximum and path minimum loss, then verify that the added attenuation still leaves adequate weak-signal margin.