How the Responsivity Calculator Works
A photodiode converts incident photons (optical power) into electrons (electrical current). The efficiency of this conversion depends heavily on the wavelength of the light and the material of the sensor. Responsivity (\(R\)) measures the electrical current generated per watt of incident light, while Quantum Efficiency (QE) is the percentage of incident photons that successfully create an electron-hole pair.
Where:
- \(R\) Responsivity in Amperes per Watt (A/W).
- \(QE\) Quantum Efficiency as a decimal (e.g., 0.80 for 80%).
- \(\lambda\) Wavelength of the light in nanometers (nm).
- \(1239.8\) A fundamental constant representing \(\frac{h \cdot c}{q}\) (Planck's constant \(\times\) speed of light \(\div\) elementary charge).
Understanding Noise Equivalent Power (NEP)
In real-world applications, your signal must be stronger than the intrinsic noise of the detector. If no light is hitting the sensor, it still generates a tiny amount of Dark Current (\(I_d\)). The Noise Equivalent Power (NEP) tells you the absolute minimum optical power required to generate a signal equal to this noise floor (a Signal-to-Noise Ratio of 1).
Quick Reference
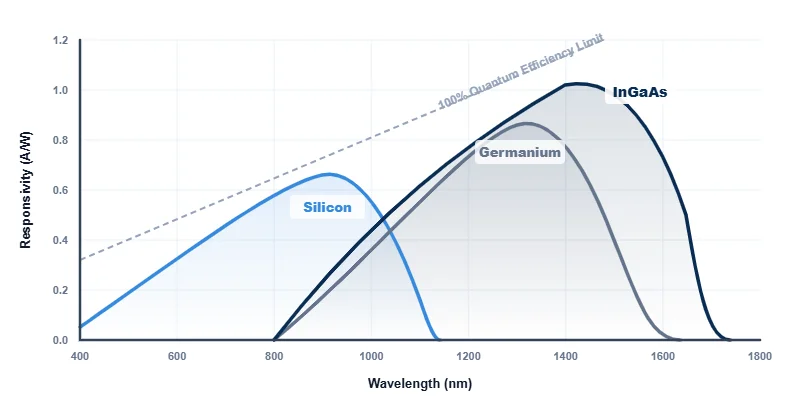
- Silicon (Si): Best for visible light and NIR (400 nm to 1100 nm). Ideal for 850 nm datacom links.
- Indium Gallium Arsenide (InGaAs): Best for Telecom bands (900 nm to 1700 nm). Peak responsivity is extremely high around 1550 nm.
- Cooling matters: Thermoelectric cooling (TEC) significantly reduces dark current, which directly lowers the NEP and improves your minimum detectable power.
- Linearity limit: If you exceed the maximum optical power threshold (saturation), the responsivity drops and the current is no longer linearly proportional to the incoming light.
Typical Peak Responsivity by Material
Average peak Amperes per Watt (A/W) based on standard sensor bandgaps.